Time Evolution of the Expectation Value of X, and also its Fluctuation, for Superconducting Josephson Junctions
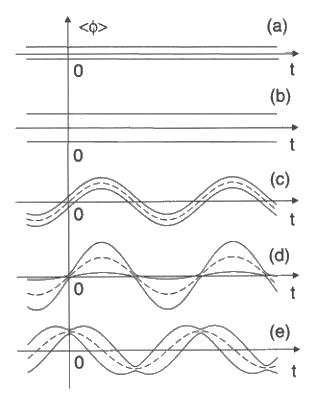
Schematic diagram of the time evolution of both the expectation value <f>(t) and the fluctuation <[Df]^2>(t) of the phase operator f for different states:
(a) vacuum,
(b) number,
(c) coherent,
(d) and (e) squeezed.
Here dashed lines represent <f>(t), while solid lines represent the envelopes <f> ± (<[Df]^2>(t))^0.5, which procide the upper and lower bounds for the fluctuating quantity f(t). (a) For the vacuum state |0>, <f>(t) = 0 and <[Df]^2>(t) = 2(EJ/EC)^0.5. (b) For a number state |n>, <f>(t) = 0 and <[Df]^2>(t) = 2n +1. (c) For a coherent state |a>, <f>(t) = 2Re(aexp(-iwt)) = 2|a|coswt, which means that a is real, and <[Df]^2>(t) = 2. (d) For a squeezed state |aexp(-iwt), x(t)>, where the squeezing factor x(t) satisfies
x(t) = rexp(-2iwt), <f>(t) = 2|a|coswt,
which means that a is real and its fluctuation is
<[Df]^2>(t) = 2[exp(-2r)cos^2wt + exp(2r)sin^2wt].
(e) A squeezed state as in (d). Now the expectation value of f is <f>(t) = 2|a|sinwt, which means that a is purely imaginary, and the fluctuation <[Df]^2>(t) has the same time-dependence as in (d). Notice that the squeezing effect now appears at the times when <f>(t) reaches its maxima while in (d) the squeezing effect is present at the times when <f>(t) is close to zero.
Image Source: X. Hu, Quantum Fluctuations In Condensed Matter Systems,
UM Ph.D. thesis 1997, Page 104.
X. Hu and F. Nori, UM Preprint, 1995.